Porsche did best at the MOT, Dacia worst
Porsche cars failed their 2025 MOT less than half as often as cars of the same age: 9.1%, against about 22%. Dacia did worst (30% vs about 21%). The comparison covers 32 brands with at least 50,000 tests.
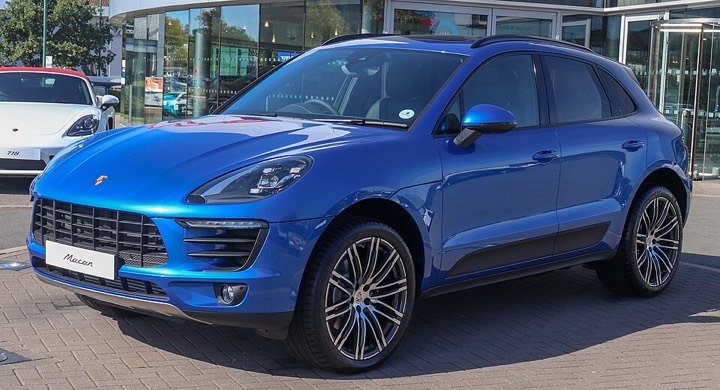
Top five
Porsche, Lexus, Honda lead. 13 of the 32 brands are within three percentage points of the average for cars of the same age, so for most brands the differences are small.
Adjusting for age changes the order. On raw failure rate alone Tesla would rank 3, but compared with cars of the same age it ranks 23. Brands have fleets of different ages, and raw figures favour brands whose cars are newer on average.
Porsche and Lexus fail least often, Dacia most often
Cars aged 3–15, MOT tests in 2025. All car models of the brand combined; van models left out.
Show as table
| Brand | Difference vs same age | Failure rate 3–15 yrs | Failure rate all | Tests |
|---|---|---|---|---|
| Porsche | −13.0 pp | 9.1% | 12.5% | 125,188 |
| Lexus | −10.9 pp | 12.4% | 16.1% | 132,564 |
| Honda | −8.0 pp | 19.2% | 27.6% | 579,674 |
| Mini | −5.9 pp | 16.0% | 16.3% | 560,123 |
| Jaguar | −5.6 pp | 17.5% | 20.6% | 272,433 |
| Land Rover | −5.5 pp | 19.4% | 23.2% | 677,875 |
| BMW | −5.5 pp | 18.6% | 20.7% | 1,571,399 |
| Audi | −5.3 pp | 19.3% | 21.5% | 1,521,752 |
| Toyota | −4.5 pp | 19.6% | 24.6% | 1,215,836 |
| Mercedes-Benz | −3.5 pp | 19.9% | 22.1% | 1,341,551 |
| Volkswagen | −3.1 pp | 22.1% | 26.2% | 2,084,582 |
| Suzuki | −2.7 pp | 22.2% | 26.4% | 349,477 |
| Skoda | −2.6 pp | 21.3% | 23.6% | 724,649 |
| Volvo | −2.3 pp | 21.2% | 24.6% | 495,374 |
| Mazda | −2.0 pp | 23.2% | 27.1% | 406,049 |
| Mitsubishi | −1.8 pp | 23.4% | 27.7% | 146,538 |
| Smart | −1.5 pp | 25.9% | 29.4% | 57,563 |
| Hyundai | +0.2 pp | 24.4% | 26.1% | 868,842 |
| Kia | +0.5 pp | 23.5% | 24.8% | 955,969 |
| Seat | +0.8 pp | 24.3% | 26.1% | 510,049 |
| Ford | +1.4 pp | 28.2% | 31.2% | 2,863,773 |
| Alfa Romeo | +1.7 pp | 30.6% | 32.2% | 52,482 |
| Tesla | +2.6 pp | 16.4% | 16.1% | 136,166 |
| Jeep | +2.7 pp | 25.6% | 27.4% | 59,777 |
| MG | +3.3 pp | 17.9% | 19.2% | 137,436 |
| Nissan | +3.5 pp | 29.4% | 31.9% | 1,295,047 |
| Fiat | +3.8 pp | 31.1% | 33.1% | 516,704 |
| Peugeot | +4.1 pp | 29.9% | 32.9% | 917,458 |
| Vauxhall | +4.3 pp | 31.2% | 33.6% | 2,110,308 |
| Citroen | +5.6 pp | 32.7% | 35.0% | 606,198 |
| Renault | +8.1 pp | 33.7% | 36.6% | 634,494 |
| Dacia | +9.3 pp | 30.1% | 30.0% | 216,526 |
Source: DVSA anonymised MOT tests (OGL v3.0)
How we calculated this
Why adjust for age? Older cars fail far more often, so a raw failure rate would simply favour newer models. Each model is therefore compared only with cars from the same year, weighted by the number of tests.