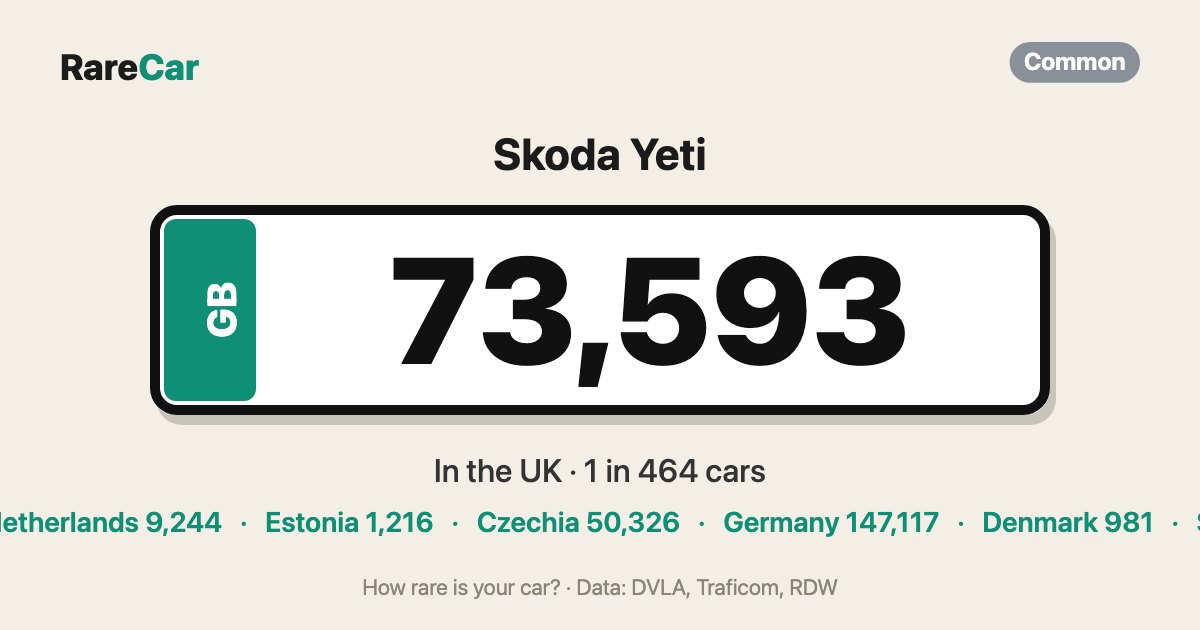
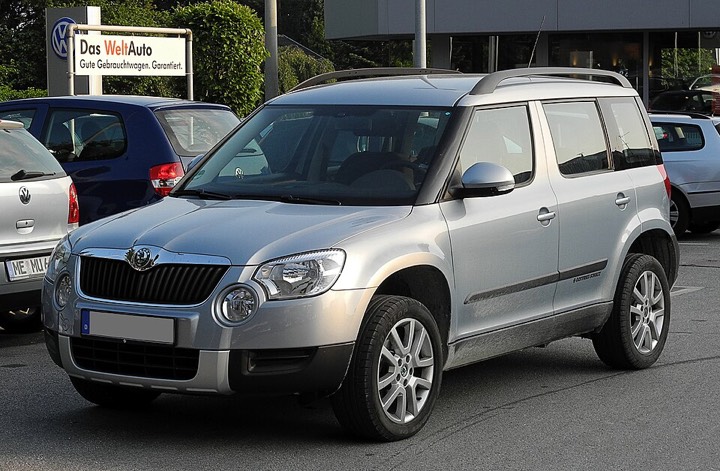
Skoda Yeti: how many are left, MOT pass rate and common faults
The Skoda Yeti is the 119th most common car in the UK: 73,593 are licensed, or one in every 464 cars (DVLA, as of 31 Dec 2025). In 2025 MOT tests the Yeti failed 13% less often than cars of the same age (26% vs 30%). The most common failure item was suspension arms: 7.6 per 100 tests, 1.8 times as often as the average car.

Country comparison
Cars per 100,000 registered cars.
UK cars vs Europe: the models that are far more common here →
Most common MOT failure: suspension arms
Failure items per 100 MOT tests in 2025, compared with all cars. One car can have several failure items.
Show as table
| Item | / 100 tests | Average | Ratio |
|---|---|---|---|
| Suspension arms · Suspension | 7.6 | 4.3 | 1.8× |
| Headlamp aim · Lamps, reflectors and electrical equipment | 4.8 | 4.4 | 1.1× |
| Springs · Suspension | 4.5 | 2.8 | 1.6× |
| Anti-roll bars · Suspension | 4.5 | 2.8 | 1.6× |
| Condition · Tyres | 4.0 | 4.8 | 0.8× |
| Mechanical brake components · Brakes | 3.2 | 3.4 | 1.0× |
Yeti: best year 2017, worst 2009
The model's fail rate, with the rate for all cars first used in the same year in brackets (MOT tests in 2025, at least 100 tests).
Skoda Yeti by year
MOT fail rate and median mileage from DVSA MOT tests in 2025.
Show as table
| Year | 🇬🇧 United Kingdom | 🇫🇮 Finland | 🇳🇱 Netherlands | 🇪🇪 Estonia | 🇨🇿 Czechia | 🇩🇪 Germany | 🇩🇰 Denmark | 🇨🇭 Switzerland | MOT fail rate | Miles |
|---|---|---|---|---|---|---|---|---|---|---|
| 2026 | – | – | – | – | hid. | – | – | – | – | – |
| 2025 | – | – | – | – | hid. | – | – | – | – | – |
| 2024 | – | – | – | – | hid. | – | – | – | – | – |
| 2023 | – | – | – | – | hid. | – | – | – | – | – |
| 2022 | – | – | – | – | hid. | – | – | hid. | – | – |
| 2021 | – | – | – | – | hid. | – | – | – | – | – |
| 2020 | – | – | hid. | – | hid. | – | – | – | – | – |
| 2019 | – | – | – | – | hid. | – | – | hid. | – | – |
| 2018 | 49 | 9 | hid. | – | 49 | – | – | hid. | 25.0% | 48k miles |
| 2017 | 11,098 | 290 | 594 | 96 | 4,000 | – | 88 | 968 | 17.7% | 51k miles |
| 2016 | 13,018 | 605 | 1,016 | 86 | 5,860 | – | 153 | 1,896 | 21.4% | 60k miles |
| 2015 | 12,392 | 631 | 1,072 | 132 | 6,550 | – | 140 | 1,947 | 24.9% | 69k miles |
| 2014 | 11,958 | 727 | 825 | 143 | 6,683 | – | 150 | 1,881 | 27.2% | 78k miles |
| 2013 | 9,964 | 707 | 787 | 189 | 4,727 | – | 166 | 1,525 | 28.9% | 88k miles |
| 2012 | 6,377 | 808 | 1,364 | 274 | 6,388 | – | 139 | 1,467 | 32.6% | 99k miles |
| 2011 | 4,828 | 867 | 1,680 | 175 | 6,791 | – | 72 | 1,111 | 34.3% | 101k miles |
| 2010 | 3,330 | 701 | 1,804 | 101 | 6,992 | – | 61 | 737 | 38.2% | 109k miles |
| 2009 | 480 | 89 | hid. | 20 | 2,260 | – | 12 | hid. | 39.8% | 116k miles |
| 1997 | – | – | – | – | hid. | – | – | – | – | – |
| 1996 | – | – | – | – | hid. | – | – | – | – | – |
Check how rare your own car is →
Other Skoda models
Fabia · Octavia · Karoq · Kodiaq · Superb · Kamiq · Citigo · Enyaq · Scala · Rapid · Roomster · Elroq · Felicia · Rapidspbk · Rapidspaceback · Favorit
Cite this page
You may use the figures and charts freely with a credit and a link to this page.
Source: RareCar (DVLA/DVSA data), 31 Dec 2025. https://rarecar.eu/uk/cars/skoda/yeti/