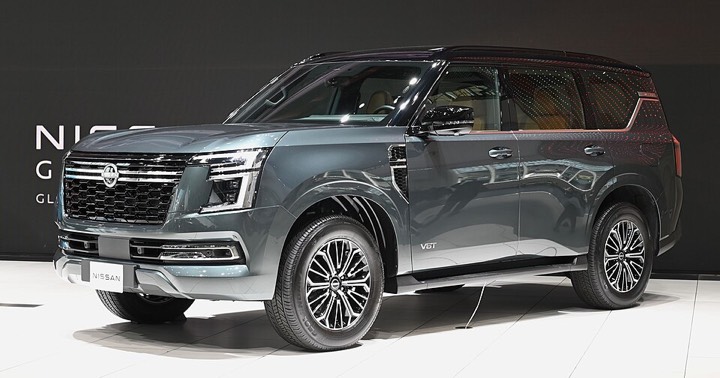
Nissan Patrol: how many are left, MOT pass rate and common faults
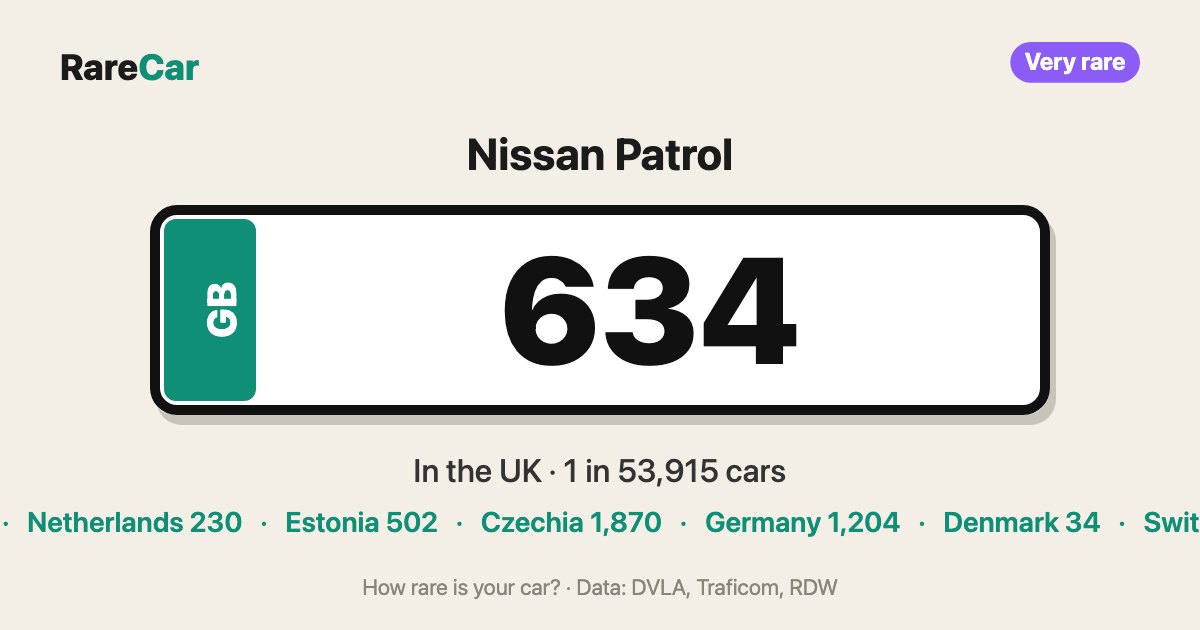
The Nissan Patrol is the 804th most common car in the UK: 634 are licensed, or one in every 53,915 cars (DVLA, as of 31 Dec 2025). In 2025 MOT tests the Patrol failed 23% less often than cars of the same age (32% vs 41%). The most common failure item was brake performance: 12 per 100 tests, 2.8 times as often as the average car.

Country comparison
Cars per 100,000 registered cars.
UK cars vs Europe: the models that are far more common here →
Most common MOT failure: brake performance
Failure items per 100 MOT tests in 2025, compared with all cars. One car can have several failure items.
Show as table
| Item | / 100 tests | Average | Ratio |
|---|---|---|---|
| Brake performance · Brakes | 11.6 | 4.2 | 2.8× |
| Anti-roll bars · Suspension | 7.7 | 2.8 | 2.8× |
| Rigid brake pipes · Brakes | 7.7 | 1.0 | 8.1× |
| Chassis · Body, chassis, structure | 7.5 | 0.3 | 22.5× |
| Position lamps · Lamps, reflectors and electrical equipment | 5.0 | 2.9 | 1.7× |
| Steering linkage components · Steering | 4.7 | 2.0 | 2.4× |
Nissan Patrol by year
MOT fail rate and median mileage from DVSA MOT tests in 2025.
Show as table
| Year | 🇬🇧 United Kingdom | 🇫🇮 Finland | 🇳🇱 Netherlands | 🇪🇪 Estonia | 🇨🇿 Czechia | 🇩🇪 Germany | 🇩🇰 Denmark | 🇨🇭 Switzerland | MOT fail rate | Miles |
|---|---|---|---|---|---|---|---|---|---|---|
| 2024 | – | – | – | – | hid. | – | – | – | – | – |
| 2023 | – | – | – | – | hid. | – | – | – | – | – |
| 2022 | – | – | – | – | hid. | – | – | – | – | – |
| 2020 | – | – | – | – | hid. | – | – | – | – | – |
| 2019 | – | – | – | – | hid. | – | – | – | – | – |
| 2016 | – | – | hid. | – | hid. | – | – | – | – | – |
| 2015 | – | – | – | – | hid. | – | – | hid. | – | – |
| 2013 | – | – | – | – | – | – | – | hid. | – | – |
| 2012 | – | – | hid. | – | – | – | – | – | – | – |
| 2011 | hid. | – | – | – | hid. | – | – | – | – | – |
| 2010 | – | – | – | hid. | – | – | – | hid. | – | – |
| 2009 | 8 | – | – | hid. | hid. | – | – | 22 | 20.0% | 104k miles |
| 2008 | 22 | – | hid. | hid. | 21 | – | – | 33 | 42.9% | 104k miles |
| 2007 | 32 | 1 | hid. | hid. | 23 | – | – | 21 | 25.0% | 108k miles |
| 2006 | 44 | – | hid. | 38 | 22 | – | – | 45 | 23.6% | 112k miles |
| 2005 | 79 | 1 | hid. | 21 | 39 | – | – | 42 | 32.7% | 118k miles |
| 2004 | 129 | 1 | hid. | 29 | 48 | – | – | 48 | 33.7% | 129k miles |
| 2003 | 48 | 3 | hid. | 27 | 65 | – | hid. | 39 | 32.4% | 132k miles |
| 2002 | 32 | 1 | hid. | 34 | 55 | – | – | 36 | 36.8% | 120k miles |
| 2001 | 16 | 1 | hid. | 45 | 90 | – | – | 27 | 21.4% | 126k miles |
| 2000 | 29 | – | hid. | 37 | 142 | – | – | 28 | 25.6% | 131k miles |
| 1999 | 23 | – | hid. | 40 | 198 | – | hid. | 22 | 21.6% | 116k miles |
| 1998 | 28 | 2 | hid. | 21 | 212 | – | – | 22 | 26.9% | 130k miles |
| 1997 | 21 | – | hid. | hid. | 77 | – | – | 8 | 36.7% | 119k miles |
| 1996 | 12 | – | hid. | hid. | 100 | – | – | 8 | 31.6% | 138k miles |
| 1995 | 11 | – | – | 28 | 111 | – | – | 9 | 30.0% | 148k miles |
| 1994 | 23 | – | hid. | 8 | 91 | – | – | hid. | 16.3% | 124k miles |
| 1993 | 17 | – | hid. | 21 | 71 | – | – | 26 | 29.2% | 158k miles |
| 1992 | hid. | 1 | hid. | 12 | 117 | – | hid. | 44 | 38.9% | – |
| 1991 | hid. | 4 | hid. | 23 | 120 | – | hid. | 36 | 40.0% | – |
| 1990 | hid. | 3 | hid. | 23 | 67 | – | hid. | 46 | 40.0% | – |
| 1989 | 10 | – | hid. | 7 | 49 | – | hid. | 17 | 37.5% | 112k miles |
| 1988 | hid. | 2 | hid. | 8 | 31 | – | hid. | hid. | 33.3% | – |
| 1987 | hid. | 1 | 19 | 9 | 19 | – | 10 | hid. | – | – |
| 1986 | – | 1 | 44 | hid. | 29 | – | hid. | hid. | – | – |
| 1985 | hid. | 1 | 33 | 12 | 40 | – | hid. | hid. | – | – |
| 1984 | – | – | 36 | 7 | 10 | – | – | hid. | – | – |
| 1983 | hid. | – | 9 | hid. | hid. | – | hid. | – | – | – |
| 1982 | – | – | 7 | hid. | – | – | hid. | – | – | – |
| 1981 | – | – | hid. | hid. | hid. | – | – | – | – | – |
| 1972 | – | – | hid. | – | – | – | – | – | – | – |
| 1967 | – | – | hid. | – | – | – | – | – | – | – |
Check how rare your own car is →
Other Nissan models
Qashqai · Juke · Micra · Note · X-Trail · Leaf · Pulsar · Ariya · Pixo · Qashqai+2 · Almera · Pathfinder · 350Z · NV200 · Primera · 370Z · GT · Almera Tino · Elgrand · Cube · 200 · Murano · Terrano · Skyline
Cite this page
You may use the figures and charts freely with a credit and a link to this page.
Source: RareCar (DVLA/DVSA data), 31 Dec 2025. https://rarecar.eu/uk/cars/nissan/patrol/