Renault Espace: how many are left, MOT pass rate and common faults
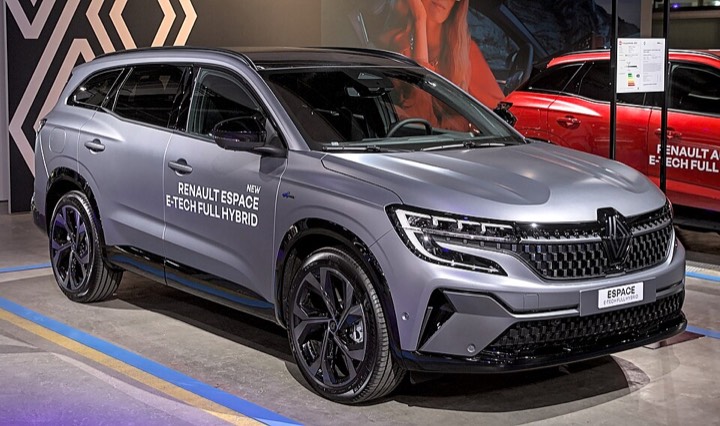
The Renault Espace is the 769th most common car in the UK: 778 are licensed, or one in every 43,936 cars (DVLA, as of 31 Dec 2025). In 2025 MOT tests the Espace failed 14% more often than cars of the same age (48% vs 42%). The most common failure item was brake performance: 12 per 100 tests, 2.8 times as often as the average car.

Country comparison
Cars per 100,000 registered cars.
Most common MOT failure: brake performance
Failure items per 100 MOT tests in 2025, compared with all cars. One car can have several failure items.
Show as table
| Item | / 100 tests | Average | Ratio |
|---|---|---|---|
| Brake performance · Brakes | 11.8 | 4.2 | 2.8× |
| Headlamp aim · Lamps, reflectors and electrical equipment | 11.3 | 4.4 | 2.5× |
| Suspension arms · Suspension | 10.9 | 4.3 | 2.5× |
| Steering linkage components · Steering | 10.3 | 2.0 | 5.2× |
| Springs · Suspension | 7.0 | 2.8 | 2.5× |
| Position lamps · Lamps, reflectors and electrical equipment | 7.0 | 2.9 | 2.4× |
Renault Espace by year
MOT fail rate and median mileage from DVSA MOT tests in 2025.
Show as table
| Year | 🇬🇧 United Kingdom | 🇫🇮 Finland | 🇳🇱 Netherlands | 🇪🇪 Estonia | 🇨🇿 Czechia | 🇩🇪 Germany | 🇩🇰 Denmark | 🇨🇭 Switzerland | MOT fail rate | Miles |
|---|---|---|---|---|---|---|---|---|---|---|
| 2026 | – | 4 | 563 | 18 | 135 | – | – | 335 | – | – |
| 2025 | – | 10 | 933 | 13 | 156 | – | – | 422 | – | – |
| 2024 | – | 46 | 1,045 | 42 | 136 | – | – | 644 | – | – |
| 2023 | – | 4 | 343 | hid. | 41 | – | hid. | 358 | – | – |
| 2022 | – | – | hid. | – | hid. | – | – | 93 | – | – |
| 2021 | – | 1 | 39 | 15 | 29 | – | – | 213 | – | – |
| 2020 | – | – | 59 | 15 | 51 | – | hid. | 194 | – | – |
| 2019 | – | 4 | 253 | 26 | 114 | – | 25 | 376 | – | – |
| 2018 | – | 6 | 398 | 70 | 114 | – | 21 | 378 | – | – |
| 2017 | – | 14 | 553 | 97 | 241 | – | 31 | 456 | – | – |
| 2016 | – | 33 | 958 | 122 | 352 | – | 87 | 775 | – | – |
| 2015 | – | 11 | 706 | 113 | 300 | – | 80 | 673 | – | – |
| 2014 | – | – | 42 | 10 | 131 | – | hid. | 290 | – | – |
| 2013 | – | 3 | 112 | 16 | 188 | – | hid. | 350 | – | – |
| 2012 | 13 | 3 | 132 | 20 | 215 | – | hid. | 573 | 46.7% | 106k miles |
| 2011 | 34 | 3 | 127 | 30 | 289 | – | 6 | 442 | 52.6% | 116k miles |
| 2010 | 69 | 4 | 236 | 26 | 296 | – | 6 | 427 | 46.9% | 126k miles |
| 2009 | 67 | 8 | 190 | 24 | 295 | – | 5 | 258 | 48.5% | 122k miles |
| 2008 | 97 | 15 | 280 | 47 | 536 | – | 12 | 312 | 51.6% | 128k miles |
| 2007 | 152 | 16 | 445 | 62 | 630 | – | hid. | 409 | 52.7% | 130k miles |
| 2006 | 62 | 22 | 373 | 73 | 571 | – | hid. | 259 | 42.4% | 109k miles |
| 2005 | 43 | 21 | 209 | 55 | 441 | – | hid. | 126 | 32.3% | 112k miles |
| 2004 | 42 | 22 | 236 | 42 | 474 | – | hid. | 90 | 40.0% | 98k miles |
| 2003 | 21 | 10 | 147 | 28 | 473 | – | hid. | 74 | 35.5% | 89k miles |
| 2002 | 46 | 2 | 56 | 9 | 129 | – | – | 54 | 48.9% | 108k miles |
| 2001 | 21 | 3 | 86 | hid. | 141 | – | hid. | 62 | 37.5% | 82k miles |
| 2000 | 14 | – | 71 | hid. | 187 | – | – | 55 | 20.0% | 116k miles |
| 1999 | 12 | 2 | 53 | hid. | 225 | – | – | 52 | 50.0% | 124k miles |
| 1998 | 11 | – | 25 | hid. | 271 | – | – | 23 | 0.0% | 186k miles |
| 1997 | hid. | – | 24 | – | 230 | – | – | 23 | – | – |
| 1996 | 9 | 2 | 12 | hid. | 66 | – | – | 20 | 44.4% | 142k miles |
| 1995 | 10 | 1 | 14 | hid. | 93 | – | – | 14 | 20.0% | 173k miles |
| 1994 | 16 | 3 | 12 | hid. | 83 | – | – | 14 | 26.3% | 202k miles |
| 1993 | 13 | – | 9 | hid. | 76 | – | – | hid. | 50.0% | 185k miles |
| 1992 | hid. | – | hid. | hid. | 74 | – | hid. | 9 | – | – |
| 1991 | hid. | – | 9 | – | 66 | – | hid. | hid. | – | – |
| 1990 | 7 | – | hid. | hid. | 61 | – | – | 12 | 37.5% | 168k miles |
| 1989 | hid. | – | 14 | – | 46 | – | – | hid. | – | – |
| 1988 | – | – | 14 | – | 42 | – | – | hid. | – | – |
| 1987 | hid. | – | hid. | – | 49 | – | – | hid. | – | – |
| 1986 | hid. | – | 26 | – | 20 | – | – | hid. | – | – |
| 1985 | – | – | 37 | hid. | hid. | – | – | hid. | – | – |
| 1984 | – | – | hid. | – | – | – | hid. | – | – | – |
Check how rare your own car is →
Other Renault models
Clio · Captur · Megane · Kadjar · Scenic · Zoe · Twingo · Capturd · Arkana · Grand Scenic · Austral · Trafic · Modus · Symbioz · Kangoo · 5 · Laguna · Koleos · Master · Megane Scenic · Rafale · Wind · Grand · 4 · Capturexprnconvce