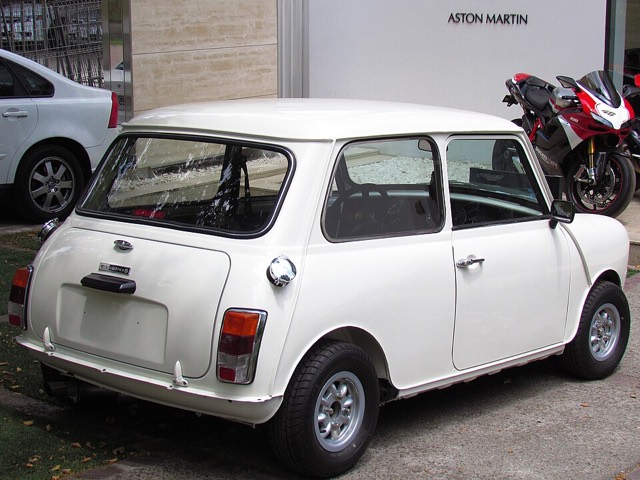
2013 Mini Cooper S: how many are left, MOT pass rate and mileage
2013 Mini Cooper S cars failed their 2025 MOT 24% less often than other cars of the same age (26% vs 34%). There are 3,114 of them licensed, one in every 10,977 cars (DVLA). Typical mileage at the MOT is about 67,000 miles, and half of the cars show 51,000–85,000 miles. The most common failure item was position lamps: 7.3 per 100 tests, 1.8 times as often as the average car.

Licensed in the UK
3,114
1 in 10,977 cars
MOT fail rate 2025
26.0%
same-age cars 34.4%
Typical mileage
67k miles
half between 51k and 85k miles
Age
12 yrs
first used 2013
Cooper SAll cars
Cooper S 2013: 67k milesAll cars 2013: 87k miles
067k miles95k miles
Most common MOT failure: position lamps
Failure items per 100 MOT tests in 2025, compared with all cars first used in 2013. One car can have several failure items.
Cooper SAll cars
Position lamps · Lamps, reflectors and electrical equipment
7.3
4.1
Condition · Tyres
5.0
5.1
Shock absorbers · Suspension
3.4
1.6
Headlamp aim · Lamps, reflectors and electrical equipment
3.2
5.1
Stop lamp · Lamps, reflectors and electrical equipment
3.0
3.1
Exhaust emissions · Noise, emissions and leaks
2.9
4.1
Show as table
| Item | / 100 tests | Average | Ratio |
|---|---|---|---|
| Position lamps · Lamps, reflectors and electrical equipment | 7.3 | 4.1 | 1.8× |
| Condition · Tyres | 5.0 | 5.1 | 1.0× |
| Shock absorbers · Suspension | 3.4 | 1.6 | 2.1× |
| Headlamp aim · Lamps, reflectors and electrical equipment | 3.2 | 5.1 | 0.6× |
| Stop lamp · Lamps, reflectors and electrical equipment | 3.0 | 3.1 | 1.0× |
| Exhaust emissions · Noise, emissions and leaks | 2.9 | 4.1 | 0.7× |
Country comparison, 2013 models
Cars per 100,000 registered cars.
🇬🇧 United Kingdom31 Dec 2025
3,114 cars · 9.1 per 100,000
🇫🇮 Finland30 Sep 2026
50 cars · 1.8 per 100,000
🇳🇱 Netherlands15 Nov 2026
617 cars · 6.1 per 100,000
🇪🇪 Estonia1 Nov 2026
14 cars · 2.0 per 100,000
🇨🇿 Czechia1 Nov 2026
109 cars · 1.6 per 100,000
🇩🇪 Germany1 Jan 2026
no year data
🇩🇰 Denmark15 Nov 2026
27 cars · 0.9 per 100,000
🇨🇭 Switzerland31 Oct 2026
1,290 cars · 26.4 per 100,000
Check how rare your own car is →
Cite this page
You may use the figures and charts freely with a credit and a link to this page.
Source: RareCar (DVLA/DVSA data), 31 Dec 2025. https://rarecar.eu/uk/cars/mini/cooper-s/2013/