How rare is your car? Built on open registration data

2024 Mercedes-Benz Vito: how many are left, MOT pass rate and mileage

2024 Mercedes-Benz Vito cars failed their 2025 MOT 1.6 times as often as other cars of the same age (9.3% vs 6.0%). There are 731 of them licensed, one in every 46,760 cars (DVLA). Typical mileage at the MOT is about 25,000 miles, and half of the cars show 11,000–43,000 miles. The most common failure item was mechanical brake components: 4.6 per 100 tests, 13 times as often as the average car.
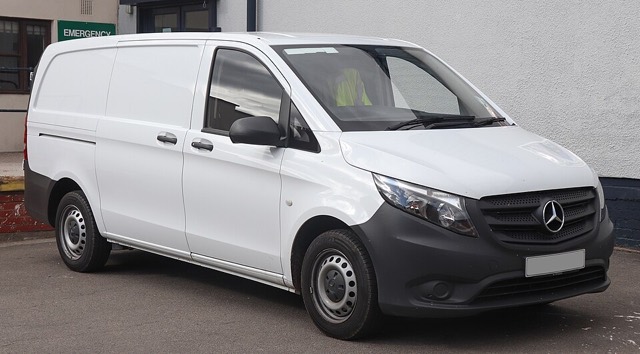
Mercedes-Benz Vito (W447)
Mercedes-Benz Vito (W447) (2015–2025). Photo: Vauxford · CC BY-SA 4.0 · Wikimedia Commons
Licensed in the UK
731
1 in 46,760 cars
MOT fail rate 2025
9.3%
same-age cars 6.0%
Typical mileage
25k miles
half between 11k and 43k miles
Age
1 yrs
first used 2024
Failure rate by year
VitoAll cars
20240%20%40%60%20002005201020152020All cars 1998: 35.0%All cars 1999: 35.8%All cars 2000: 37.7%All cars 2001: 39.0%All cars 2002: 40.5%All cars 2003: 41.4%All cars 2004: 42.4%All cars 2005: 42.5%All cars 2006: 43.1%All cars 2007: 42.7%All cars 2008: 43.0%All cars 2009: 41.9%All cars 2010: 40.9%All cars 2011: 38.9%All cars 2012: 36.7%All cars 2013: 34.4%All cars 2014: 31.4%All cars 2015: 28.2%All cars 2016: 25.1%All cars 2017: 21.8%All cars 2018: 19.1%All cars 2019: 16.5%All cars 2020: 14.0%All cars 2021: 12.8%All cars 2022: 11.5%All cars 2023: 8.4%All cars 2024: 6.0%Vito 1998: 54.0%Vito 2001: 48.4%Vito 2002: 49.7%Vito 2003: 53.7%Vito 2004: 47.4%Vito 2005: 46.3%Vito 2006: 42.8%Vito 2007: 43.3%Vito 2008: 42.3%Vito 2009: 39.5%Vito 2010: 39.0%Vito 2011: 38.3%Vito 2012: 35.6%Vito 2013: 35.8%Vito 2014: 34.2%Vito 2015: 33.0%Vito 2016: 31.6%Vito 2017: 28.7%Vito 2018: 27.9%Vito 2019: 25.3%Vito 2020: 24.9%Vito 2021: 23.7%Vito 2022: 16.7%Vito 2023: 11.2%Vito 2024: 9.3%9.3%
Mileage: middle half and median
Vito 2024: 25k milesAll cars 2024: 24k miles
025k miles47k miles

Most common MOT failure: mechanical brake components

Failure items per 100 MOT tests in 2025, compared with all cars first used in 2024. One car can have several failure items.

VitoAll cars
Mechanical brake components · Brakes
4.6
0.4
Show as table
Item/ 100 testsAverageRatio
Mechanical brake components · Brakes4.60.412.8×

Country comparison, 2024 models

Cars per 100,000 registered cars.

🇬🇧 United Kingdom31 Dec 2025
731 cars · 2.1 per 100,000
🇫🇮 Finland30 Sep 2026
145 cars · 5.3 per 100,000
🇳🇱 Netherlands15 Nov 2026
197 cars · 2.0 per 100,000
🇪🇪 Estonia1 Nov 2026
44 cars · 6.4 per 100,000
🇨🇿 Czechia1 Nov 2026
448 cars · 6.5 per 100,000
🇩🇪 Germany1 Jan 2026
no year data
🇩🇰 Denmark15 Nov 2026
196 cars · 6.6 per 100,000
🇨🇭 Switzerland31 Oct 2026
632 cars · 13.0 per 100,000

Selling this car?

Enter your car's mileage to get ready-made text for your advert showing how your car compares.

Copy the text and paste it into your advert.

Check how rare your own car is →

← 2023 · All years · 2025 →

Cite this page

You may use the figures and charts freely with a credit and a link to this page.

Source: RareCar (DVLA/DVSA data), 31 Dec 2025. https://rarecar.eu/uk/cars/mercedes-benz/vito/2024/
Download share image

Terms and open data