How rare is your car? Built on open registration data

2023 Mercedes-Benz Sprinter: how many are left, MOT pass rate and mileage

2023 Mercedes-Benz Sprinter cars failed their 2025 MOT less than half as often as other cars of the same age (2.8% vs 8.4%). There are 144 of them licensed, one in every 237,374 cars (DVLA). Typical mileage at the MOT is about 60,000 miles, and half of the cars show 38,000–87,000 miles.
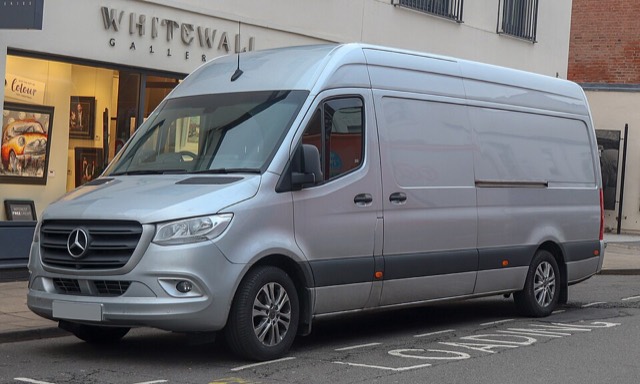
Mercedes-Benz Sprinter (Third generation (W907/W910))
Mercedes-Benz Sprinter (Third generation (W907/W910)) (2018–). Photo: Vauxford · CC BY-SA 4.0 · Wikimedia Commons
Licensed in the UK
144
1 in 237,374 cars
MOT fail rate 2025
2.8%
same-age cars 8.4%
Typical mileage
60k miles
half between 38k and 87k miles
Age
2 yrs
first used 2023
Failure rate by year
SprinterAll cars
20230%20%40%60%20002005201020152020All cars 1997: 33.7%All cars 1998: 35.0%All cars 1999: 35.8%All cars 2000: 37.7%All cars 2001: 39.0%All cars 2002: 40.5%All cars 2003: 41.4%All cars 2004: 42.4%All cars 2005: 42.5%All cars 2006: 43.1%All cars 2007: 42.7%All cars 2008: 43.0%All cars 2009: 41.9%All cars 2010: 40.9%All cars 2011: 38.9%All cars 2012: 36.7%All cars 2013: 34.4%All cars 2014: 31.4%All cars 2015: 28.2%All cars 2016: 25.1%All cars 2017: 21.8%All cars 2018: 19.1%All cars 2019: 16.5%All cars 2020: 14.0%All cars 2021: 12.8%All cars 2022: 11.5%All cars 2023: 8.4%All cars 2024: 6.0%Sprinter 1997: 51.6%Sprinter 1998: 37.9%Sprinter 1999: 36.0%Sprinter 2000: 37.7%Sprinter 2001: 36.8%Sprinter 2002: 38.6%Sprinter 2003: 38.8%Sprinter 2004: 41.4%Sprinter 2005: 38.9%Sprinter 2006: 40.5%Sprinter 2007: 35.7%Sprinter 2008: 37.1%Sprinter 2009: 32.3%Sprinter 2010: 31.4%Sprinter 2011: 33.9%Sprinter 2012: 33.8%Sprinter 2013: 30.3%Sprinter 2014: 30.4%Sprinter 2015: 25.3%Sprinter 2016: 24.7%Sprinter 2017: 20.1%Sprinter 2018: 18.8%Sprinter 2019: 16.2%Sprinter 2020: 14.5%Sprinter 2021: 16.4%Sprinter 2022: 11.4%Sprinter 2023: 2.8%Sprinter 2024: 4.4%2.8%
Mileage: middle half and median
Sprinter 2023: 60k milesAll cars 2023: 25k miles
060k miles95k miles

Country comparison, 2023 models

Cars per 100,000 registered cars.

🇬🇧 United Kingdom31 Dec 2025
144 cars · 0.4 per 100,000
🇫🇮 Finland30 Sep 2026
215 cars · 7.9 per 100,000
🇳🇱 Netherlands15 Nov 2026
716 cars · 7.1 per 100,000
🇪🇪 Estonia1 Nov 2026
17 cars · 2.5 per 100,000
🇨🇿 Czechia1 Nov 2026
190 cars · 2.8 per 100,000
🇩🇪 Germany1 Jan 2026
no year data
🇩🇰 Denmark15 Nov 2026
362 cars · 12.2 per 100,000
🇨🇭 Switzerland31 Oct 2026
30 cars · 0.6 per 100,000

Selling this car?

Enter your car's mileage to get ready-made text for your advert showing how your car compares.

Copy the text and paste it into your advert.

Check how rare your own car is →

← 2022 · All years · 2024 →

Cite this page

You may use the figures and charts freely with a credit and a link to this page.

Source: RareCar (DVLA/DVSA data), 31 Dec 2025. https://rarecar.eu/uk/cars/mercedes-benz/sprinter/2023/
Download share image

Terms and open data