Ford Explorer: how many are left, MOT pass rate and common faults
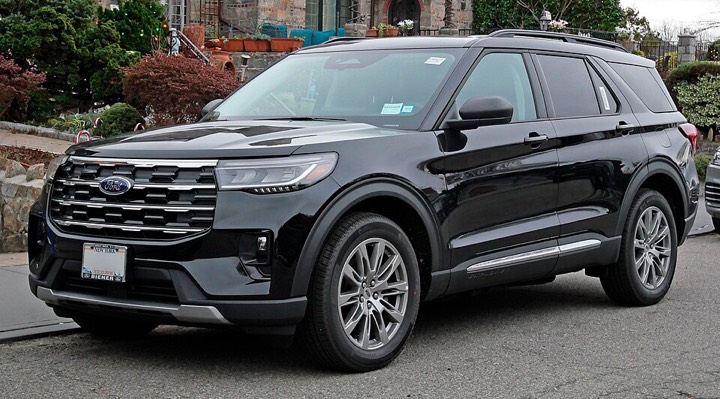
The Ford Explorer is the 285th most common car in the UK: 16,800 are licensed, or one in every 2,035 cars (DVLA, as of 31 Dec 2025). In 2025 MOT tests the Explorer failed 22% less often than cars of the same age (22% vs 29%). The most common failure item was brake performance: 10 per 100 tests, 2.5 times as often as the average car.

Country comparison
Cars per 100,000 registered cars.
Most common MOT failure: brake performance
Failure items per 100 MOT tests in 2025, compared with all cars. One car can have several failure items.
Show as table
| Item | / 100 tests | Average | Ratio |
|---|---|---|---|
| Brake performance · Brakes | 10.2 | 4.2 | 2.5× |
| Suspension arms · Suspension | 9.8 | 4.3 | 2.3× |
| Anti-roll bars · Suspension | 6.8 | 2.8 | 2.5× |
| Exhaust emissions · Noise, emissions and leaks | 5.2 | 3.6 | 1.4× |
| Headlamp aim · Lamps, reflectors and electrical equipment | 5.2 | 4.4 | 1.2× |
| Front and rear fog lamps · Lamps, reflectors and electrical equipment | 5.0 | 0.6 | 8.6× |
Ford Explorer by year
MOT fail rate and median mileage from DVSA MOT tests in 2025.
Show as table
| Year | 🇬🇧 United Kingdom | 🇫🇮 Finland | 🇳🇱 Netherlands | 🇪🇪 Estonia | 🇨🇿 Czechia | 🇩🇪 Germany | 🇩🇰 Denmark | 🇨🇭 Switzerland | MOT fail rate | Miles |
|---|---|---|---|---|---|---|---|---|---|---|
| 2026 | – | 532 | 1,195 | 9 | 143 | – | 1,637 | 239 | – | – |
| 2025 | 12,112 | 522 | 3,227 | 10 | 228 | – | 2,070 | 507 | 0.0% | 1k miles |
| 2024 | 4,522 | 236 | 1,641 | hid. | 107 | – | 2,456 | 366 | 0.0% | 27k miles |
| 2023 | – | 24 | 124 | hid. | 57 | – | hid. | 108 | – | – |
| 2022 | – | 79 | 251 | 12 | 102 | – | hid. | 164 | 20.0% | – |
| 2021 | – | 250 | 464 | hid. | 124 | – | 12 | 201 | – | – |
| 2020 | – | 167 | 264 | hid. | 52 | – | 12 | 171 | 57.1% | – |
| 2019 | – | 5 | 11 | – | hid. | – | – | 176 | 42.9% | – |
| 2018 | – | – | hid. | hid. | 10 | – | – | 17 | 0.0% | – |
| 2017 | hid. | – | 12 | hid. | 20 | – | hid. | 10 | 12.5% | – |
| 2016 | – | 3 | 15 | – | 23 | – | hid. | 30 | 28.6% | – |
| 2015 | – | 1 | 21 | hid. | hid. | – | – | 22 | 0.0% | – |
| 2014 | – | 2 | 19 | hid. | hid. | – | hid. | 34 | 23.5% | – |
| 2013 | – | 3 | 25 | hid. | 13 | – | hid. | 14 | 16.7% | – |
| 2012 | – | 2 | 16 | hid. | hid. | – | – | 35 | 20.0% | – |
| 2011 | – | 1 | 28 | hid. | 9 | – | hid. | 22 | – | – |
| 2010 | – | 2 | 18 | hid. | hid. | – | – | hid. | – | – |
| 2009 | – | 3 | 12 | hid. | hid. | – | – | hid. | – | – |
| 2008 | – | 3 | 37 | hid. | 9 | – | – | hid. | 62.5% | – |
| 2007 | – | 10 | 34 | hid. | 7 | – | – | hid. | 33.3% | – |
| 2006 | – | 15 | 35 | hid. | 13 | – | – | hid. | 37.5% | – |
| 2005 | – | 2 | 9 | hid. | hid. | – | hid. | hid. | 42.1% | – |
| 2004 | – | 2 | 25 | hid. | hid. | – | hid. | 8 | 18.5% | – |
| 2003 | – | – | 29 | hid. | 13 | – | hid. | hid. | 31.8% | – |
| 2002 | hid. | 1 | 10 | hid. | 9 | – | hid. | hid. | 27.3% | – |
| 2001 | 6 | 6 | 19 | hid. | 27 | – | – | hid. | 28.6% | 102k miles |
| 2000 | 40 | 5 | 16 | hid. | 42 | – | – | 10 | 27.4% | 95k miles |
| 1999 | 47 | 5 | 13 | hid. | 50 | – | hid. | hid. | 33.3% | 106k miles |
| 1998 | 45 | 9 | 14 | 8 | 77 | – | – | 8 | 28.3% | 108k miles |
| 1997 | 21 | 11 | 9 | 11 | 27 | – | – | hid. | 27.3% | 107k miles |
| 1996 | – | 12 | hid. | hid. | 12 | – | – | hid. | – | – |
| 1995 | – | 11 | 14 | 8 | 21 | – | – | hid. | – | – |
| 1994 | – | 1 | hid. | hid. | 10 | – | – | hid. | – | – |
| 1993 | – | 4 | hid. | hid. | 9 | – | – | hid. | – | – |
| 1992 | – | 1 | hid. | hid. | hid. | – | hid. | hid. | – | – |
| 1991 | – | – | hid. | hid. | hid. | – | – | hid. | – | – |
| 1990 | – | – | hid. | – | – | – | – | – | – | – |
Check how rare your own car is →
Other Ford models
Fiesta · Focus · Kuga · Puma · Mondeo · KA · Ecosport · C-Max · S-Max · B-Max · Galaxy · Fusion · Grand C-Max · Tourneo Custom · Tourneo Connect · Mustang Mach-E · Escort · Mustang · Capri · Edge · Focus C-Max · Cortina · Transit Custom · Independence