Dodge Avenger: how many are left, MOT pass rate and common faults
The Dodge Avenger is the 1104th most common car in the UK: 149 are licensed, or one in every 229,408 cars (DVLA, as of 31 Dec 2025). In 2025 MOT tests the Avenger failed 7% more often than cars of the same age (46% vs 43%). The most common failure item was suspension arms: 12 per 100 tests, 2.7 times as often as the average car.
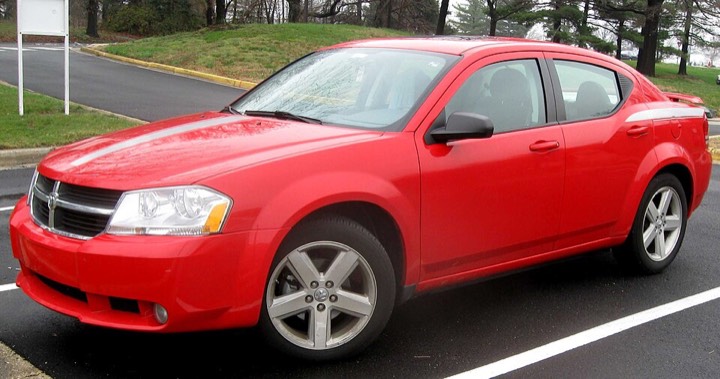

Licensed in the UK
149
1 in 229,408 cars
Popularity
#1,104
among 1,688 models
MOT fail rate 2025
44.5%
same-age cars 43.0%
Mileage at MOT
104k miles
median, all years
Country comparison
Cars per 100,000 registered cars.
🇬🇧 United Kingdom31 Dec 2025
149 cars · 0.4 per 100,000
🇫🇮 Finland30 Sep 2026
415 cars · 15.3 per 100,000
🇳🇱 Netherlands15 Nov 2026
82 cars · 0.8 per 100,000
🇪🇪 Estonia1 Nov 2026
55 cars · 8.0 per 100,000
🇨🇿 Czechia1 Nov 2026
56 cars · 0.8 per 100,000
Most common MOT failure: suspension arms
Failure items per 100 MOT tests in 2025, compared with all cars. One car can have several failure items.
AvengerAll cars
Suspension arms · Suspension
11.6
4.3
Mechanical brake components · Brakes
11.0
3.4
Headlamp aim · Lamps, reflectors and electrical equipment
9.6
4.4
Position lamps · Lamps, reflectors and electrical equipment
8.2
2.9
Tread depth · Tyres
6.8
3.1
Headlamps · Lamps, reflectors and electrical equipment
6.8
2.7
Show as table
| Item | / 100 tests | Average | Ratio |
|---|---|---|---|
| Suspension arms · Suspension | 11.6 | 4.3 | 2.7× |
| Mechanical brake components · Brakes | 11.0 | 3.4 | 3.2× |
| Headlamp aim · Lamps, reflectors and electrical equipment | 9.6 | 4.4 | 2.2× |
| Position lamps · Lamps, reflectors and electrical equipment | 8.2 | 2.9 | 2.8× |
| Tread depth · Tyres | 6.8 | 3.1 | 2.2× |
| Headlamps · Lamps, reflectors and electrical equipment | 6.8 | 2.7 | 2.5× |
Dodge Avenger by year
MOT fail rate and median mileage from DVSA MOT tests in 2025.
Show as table
| Year | 🇬🇧 United Kingdom | 🇫🇮 Finland | 🇳🇱 Netherlands | 🇪🇪 Estonia | 🇨🇿 Czechia | MOT fail rate | Miles |
|---|---|---|---|---|---|---|---|
| 2013 | – | 1 | hid. | – | – | – | – |
| 2011 | – | 2 | hid. | – | – | – | – |
| 2010 | – | 41 | hid. | hid. | hid. | – | – |
| 2009 | 41 | 112 | 33 | hid. | hid. | 47.4% | 97k miles |
| 2008 | 94 | 180 | 31 | 24 | 25 | 46.2% | 106k miles |
| 2007 | 14 | 79 | hid. | 13 | hid. | 25.0% | 118k miles |
| 1999 | – | – | – | – | hid. | – | – |
| 1997 | – | – | – | hid. | – | – | – |
| 1996 | – | – | – | hid. | – | – | – |
| 1995 | – | – | – | hid. | – | – | – |
Check how rare your own car is →