BMW M8: how many are left, MOT pass rate and common faults
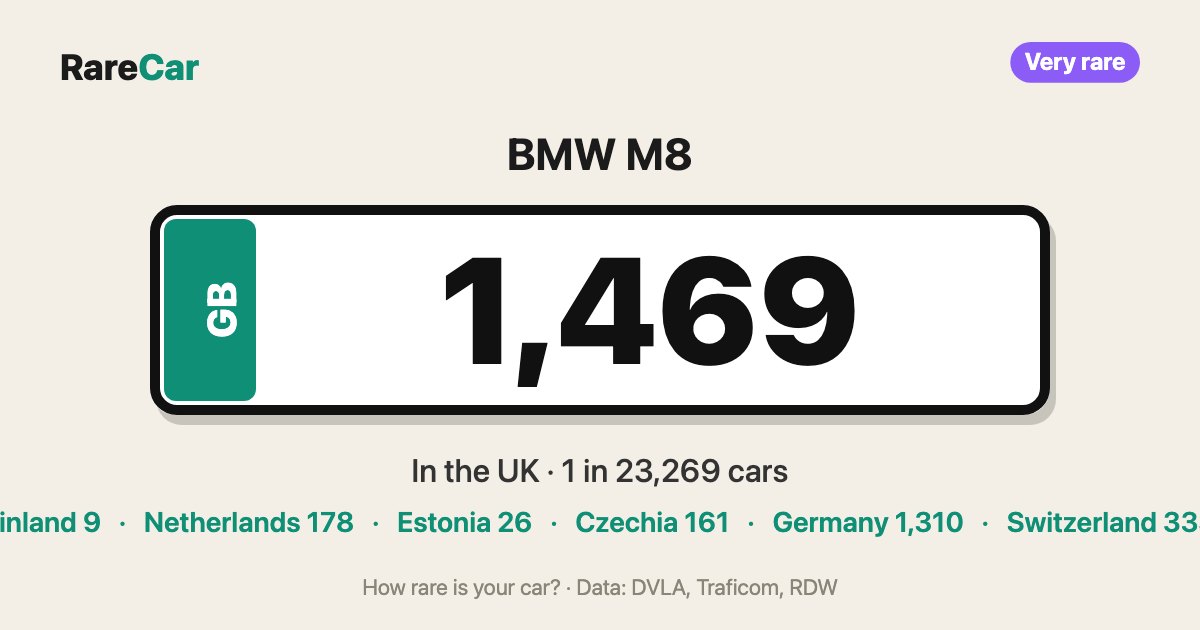
The BMW M8 is the 635th most common car in the UK: 1,469 are licensed, or one in every 23,269 cars (DVLA, as of 31 Dec 2025). In 2025 MOT tests the M8 failed 33% less often than cars of the same age (8.9% vs 13%). The most common failure item was condition: 5.5 per 100 tests, about as often as the average car.
Country comparison
Cars per 100,000 registered cars.
UK cars vs Europe: the models that are far more common here →
Most common MOT failure: condition
Failure items per 100 MOT tests in 2025, compared with all cars. One car can have several failure items.
Show as table
| Item | / 100 tests | Average | Ratio |
|---|---|---|---|
| Condition · Tyres | 5.5 | 4.8 | 1.1× |
| Registration plates · Identification of the vehicle | 3.0 | 0.4 | 7.3× |
| Tread depth · Tyres | 1.4 | 3.1 | 0.5× |
| Headlamp aim · Lamps, reflectors and electrical equipment | 1.2 | 4.4 | 0.3× |
| Exhaust emissions · Noise, emissions and leaks | 0.5 | 3.6 | 0.1× |
BMW M8 by year
MOT fail rate and median mileage from DVSA MOT tests in 2025.
Show as table
| Year | 🇬🇧 United Kingdom | 🇫🇮 Finland | 🇳🇱 Netherlands | 🇪🇪 Estonia | 🇨🇿 Czechia | 🇩🇪 Germany | 🇩🇰 Denmark | 🇨🇭 Switzerland | MOT fail rate | Miles |
|---|---|---|---|---|---|---|---|---|---|---|
| 2026 | – | – | hid. | – | – | – | – | – | – | – |
| 2025 | 129 | – | 12 | – | 10 | – | – | 12 | – | – |
| 2024 | 112 | – | hid. | hid. | 14 | – | – | 25 | – | – |
| 2023 | 164 | – | 21 | hid. | 25 | – | hid. | 43 | 0.0% | 12k miles |
| 2022 | 166 | – | hid. | hid. | 28 | – | hid. | 53 | 8.9% | 18k miles |
| 2021 | 201 | 1 | 34 | 7 | 35 | – | – | 65 | 8.1% | 25k miles |
| 2020 | 269 | 6 | 65 | hid. | 38 | – | hid. | 106 | 8.9% | 33k miles |
| 2019 | 402 | 2 | 29 | hid. | 11 | – | – | 29 | 10.7% | 29k miles |
| 2018 | 23 | – | – | – | – | – | – | – | – | – |
Check how rare your own car is →
Other BMW models
3 Series · 1 Series · 5 Series · 2 Series · X1 · X3 · 4 Series · X5 · i4 · Z4 · M1 · M3 · X2 · M2 · X4 · M4 · 6 Series · IX3 · iX1 · 7 Series · IX · I3 · X6 · i5 · IX2
Cite this page
You may use the figures and charts freely with a credit and a link to this page.
Source: RareCar (DVLA/DVSA data), 31 Dec 2025. https://rarecar.eu/uk/cars/bmw/m8/